The Bearish Engulfing Pattern: A Signal for Selling Stocks Like NVDA
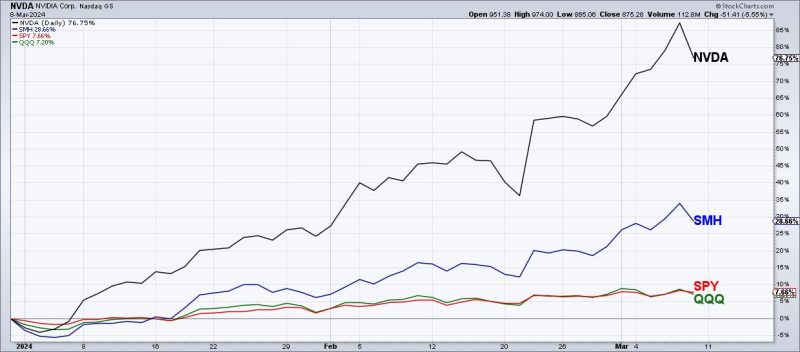
Technical analysis is a critical component of trading, providing valuable insights into market trends and potential entry or exit points. One widely recognized pattern in technical analysis is the Bearish Engulfing Pattern, which can signal a potential reversal in the direction of a stock’s price movement. Recently, this pattern marked a top for the stock NVDA, prompting traders to consider selling their positions.
The Bearish Engulfing Pattern is a two-candlestick pattern that occurs after an uptrend. The first candlestick is a bullish one, indicating upward momentum in the market. However, the second candlestick completely engulfs the body of the first candlestick, signaling a shift in momentum from bullish to bearish. This pattern suggests that the buyers are losing control, and the sellers are gaining strength.
In the case of NVDA, the Bearish Engulfing Pattern appeared on the price chart, indicating a potential top for the stock. The pattern reflects a battle between buyers and sellers, with the sellers ultimately gaining control and driving the price lower. Traders who recognized this pattern may have taken it as a sign to sell their NVDA positions and potentially profit from the downward movement.
While the Bearish Engulfing Pattern is a powerful signal, traders should exercise caution and use additional technical indicators and analysis to confirm their trading decisions. Relying solely on one pattern may not always lead to profitable trades, as market conditions can change rapidly. It is essential to consider other factors such as volume, support and resistance levels, and overall market sentiment before making trading decisions.
For traders who missed the opportunity to sell NVDA at the top, it is essential to remain vigilant and watch for further signals that may indicate a continued downward trend. Technical analysis is a dynamic field, and patterns like the Bearish Engulfing Pattern can provide valuable insights into potential market movements. By combining technical analysis with sound risk management practices, traders can navigate the markets with more confidence and make informed trading decisions.
In conclusion, the Bearish Engulfing Pattern serves as a valuable tool for traders looking to identify potential reversals in stock prices. By understanding and recognizing this pattern, traders can capitalize on market opportunities and protect their investments. While no trading strategy is foolproof, incorporating technical analysis patterns like the Bearish Engulfing Pattern can enhance a trader’s decision-making process and improve their overall trading performance in the stock market.

