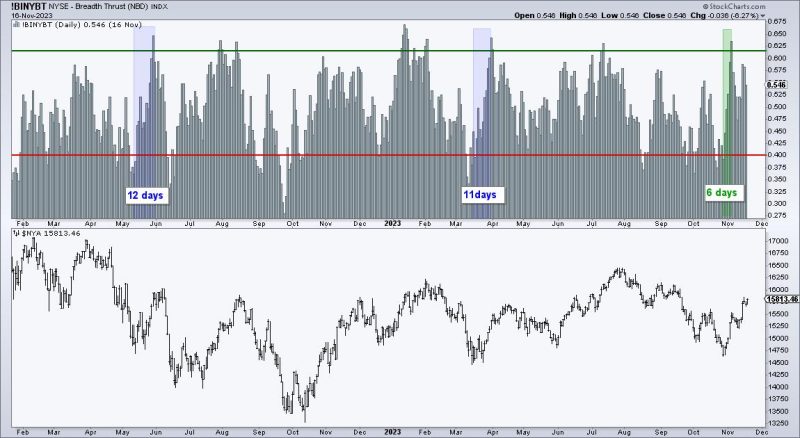
The SP 1500 is a crucial index in the financial world, as it measures the performance of large U.S. stocks. This index has long served as a benchmark for investors to gauge their portfolios against. However, many investors find it challenging to evaluate the SP 1500 in its entirety. To assist in this effort, the Zweig Breadth Thrust and other metrics provide invaluable insight into the market’s health.
The Zweig Breadth Thrust is a measure which tracks the overall direction of the market by examining the relative strength of stocks and indexes. This metric looks at the number of stocks which are rising versus those which are falling within the SP 1500. If the number of stocks rising is greater than those falling then this indicates an overall bullish market, whereas if the reverse is true, it would indicate a bearish market.
The Zweig Breadth Thrust can also be used to help identify more specific market movements, such as sectors which are performing better than others. In this case, investors can unearth potential buying and selling opportunities based on this information.
In addition to the Zweig Breadth Thrust, investors can also utilize various other metrics to gain a deeper insight into the SP1500. The Advance/Decline Ratio examines how many stocks are rising compared to those which are falling, as well as the Up/Down Price Ratio which measures the differences in percentage gains between stocks. These metrics can help investors determine if there are any possible buying or selling opportunities within the index.
Finally, investors should also be aware of the importance of tracking market trends across different time-frames. By using charting features such as moving averages and support/resistance levels, investors can observe when short-term or long-term trends may be developing and use this information to their advantage.
The SP1500 is not an easy metric to evaluate. However, by utilizing the Zweig Breadth Thrust and other metrics, investors can gain valuable insight into the index’s current condition and make informed decisions for their portfolios. These metrics can help investors spot potential opportunities in the market and react accordingly. Keeping a close eye on the various charts and indicators can be an invaluable asset to any investor.

