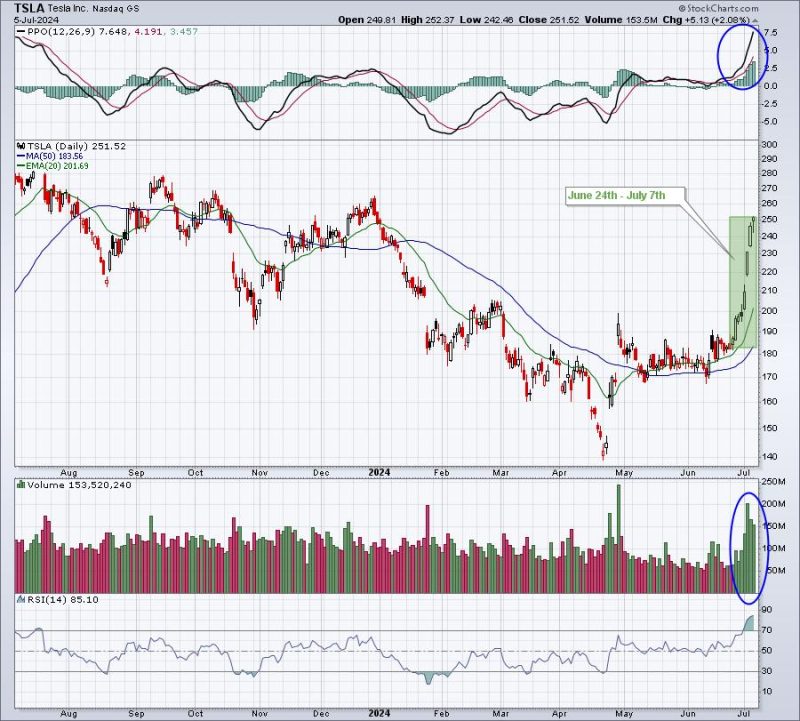
Investing in the stock market can be a complex endeavor, and one way to potentially gain an edge is by paying close attention to pre-earnings moves. As companies approach their earnings releases, the stock price often experiences notable fluctuations as investors digest upcoming financial results and adjust their positions accordingly. By studying historical patterns and trends, investors can potentially anticipate these moves and position themselves for success.
Historical data can serve as a valuable tool for investors looking to make informed decisions about pre-earnings moves. By analyzing past earnings seasons and stock price movements, investors can identify patterns and correlations that may provide insights into the likely direction of a stock following an earnings announcement.
One common phenomenon observed in the stock market is the earnings drift effect, where a stock continues to move in the direction of its pre-earnings trend after the earnings announcement. This suggests that investors who correctly anticipate pre-earnings moves can potentially profit not only before the earnings release but also in the period following it.
Additionally, studying historical data can help investors identify potential outliers or anomalies in pre-earnings moves. By comparing a company’s current pre-earnings behavior with historical patterns, investors can identify deviations that may signal a unique opportunity or a risk to be aware of.
Analysts and traders often use technical analysis to gain insights into potential pre-earnings moves. Technical indicators such as moving averages, relative strength index (RSI), and Bollinger Bands can help identify potential entry and exit points based on historical price movements and trends.
It’s important to note that historical data can provide valuable insights, but it’s not a foolproof predictor of future stock movements. Market dynamics can change, and unexpected events can impact stock prices in ways that historical data may not fully capture. Therefore, investors should use historical analysis as one tool among many in their investment toolkit.
In conclusion, studying historical data and patterns can offer valuable clues to potential pre-earnings moves in the stock market. By analyzing past earnings seasons, investors can potentially gain insights into how a stock may behave before and after an earnings announcement. Incorporating historical analysis alongside other fundamental and technical analysis can provide a more comprehensive understanding of stock price movements and help investors make more informed investment decisions.

