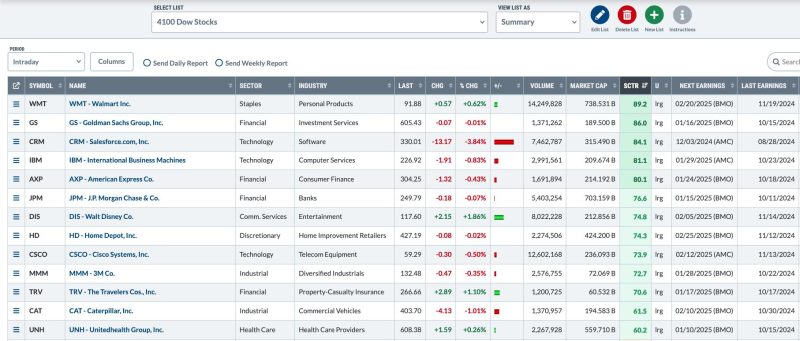
In a world inundated with data and information, utilizing tools like ChartLists can significantly enhance your ability to analyze, visualize, and interpret data effectively. With that in mind, let’s explore five practical ways you can leverage ChartLists to streamline your data-driven decision-making processes.
1. **Organization and Categorization**: One of the fundamental benefits of ChartLists is their ability to help you organize and categorize your data efficiently. By creating distinct lists for different categories or themes, you can easily retrieve relevant information whenever needed. For instance, you can have separate ChartLists for sales data, marketing metrics, financial performance, and more. This segmentation not only saves time but also allows for better focus when analyzing specific aspects of your business.
2. **Comparative Analysis**: ChartLists can be an invaluable tool when it comes to conducting comparative analysis. By placing related data sets side by side in a ChartList, you can quickly identify trends, patterns, and anomalies. Whether you are comparing sales figures of different products, website traffic over time, or customer demographics, having the data visualized in charts makes it easier to draw meaningful insights and make informed decisions.
3. **Monitoring Performance Metrics**: Keeping track of key performance indicators (KPIs) is essential for any business or project. ChartLists can serve as a centralized dashboard displaying real-time or periodic updates of your KPIs. By monitoring these metrics closely through visually engaging charts, you can promptly identify fluctuations, deviations from targets, or emerging trends. This proactive approach enables you to address issues promptly and capitalize on opportunities as they arise.
4. **Forecasting and Trend Analysis**: ChartLists can also facilitate forecasting and trend analysis by allowing you to visualize historical data and project future outcomes. By plotting historical data points and applying relevant statistical tools, you can gain insights into trends, seasonality, and potential future scenarios. Whether you are forecasting sales projections, inventory levels, or market trends, ChartLists offer a powerful platform to model different scenarios and make informed forecasts.
5. **Collaboration and Reporting**: Lastly, ChartLists provide a convenient platform for collaboration and reporting within teams or stakeholders. By sharing ChartLists with colleagues or superiors, you can ensure that everyone is on the same page regarding data analysis and insights. Moreover, you can customize charts within your ChartLists to tailor reports for specific audiences, making complex data more accessible and comprehensible to a wider range of stakeholders.
In conclusion, ChartLists are versatile tools that can significantly enhance your data analysis and decision-making processes. By leveraging the organizational, analytical, and collaborative features of ChartLists, you can transform raw data into actionable insights with ease. Whether you are a business analyst, a project manager, or a data enthusiast, incorporating ChartLists into your toolkit can elevate the way you work with data and drive success in your endeavors.

